
In this post I moved this web site from bitnami instance to Amazon Linux 2 instance.

In this post I will show how to enable to monitor LightSail instance by CloudWatch.
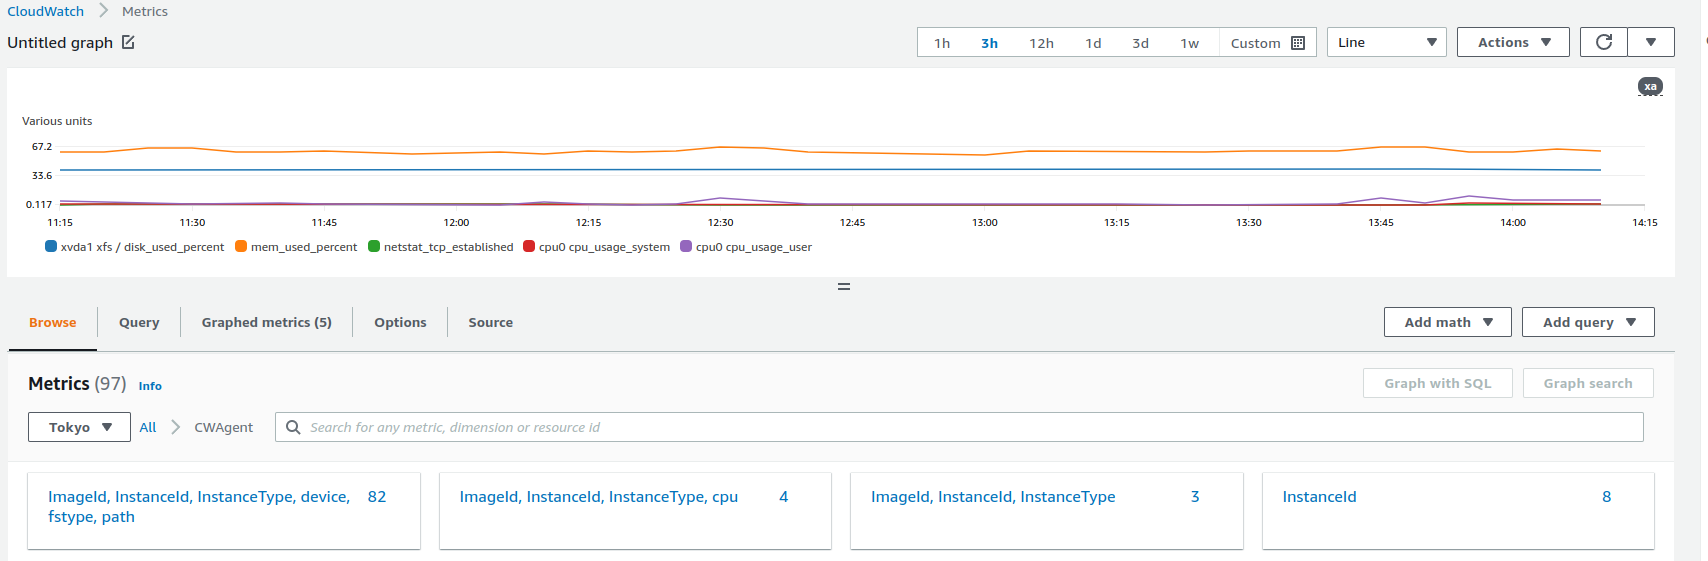
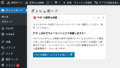
This is my dashboard of CloudWatch.
This is what I did.
- Creating IAM user for CloudWatch
- Configuring user's credential to CloudWatch daemon running on LightSail
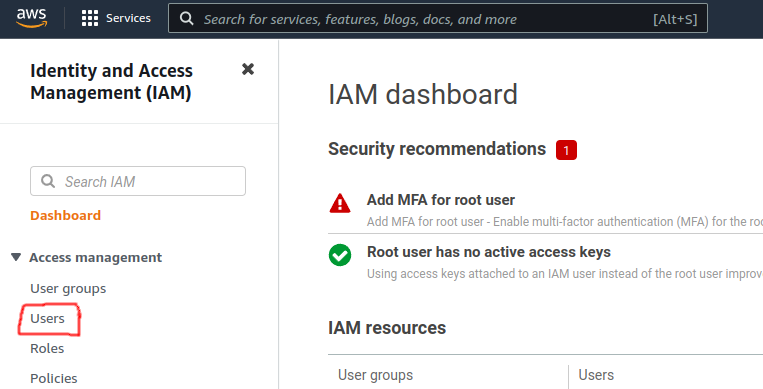
IAM
Please create IAM user for this purpose.
IAM is one of famous service by AWS so lots of sites explains, you can soon find by Google.
I show pick up my steps.
Select Users.
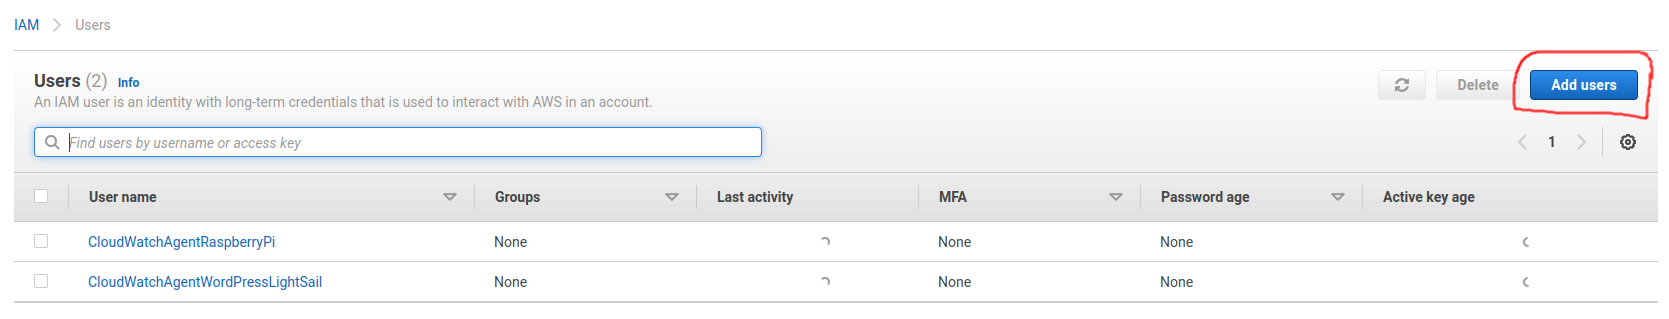
Select Add users.
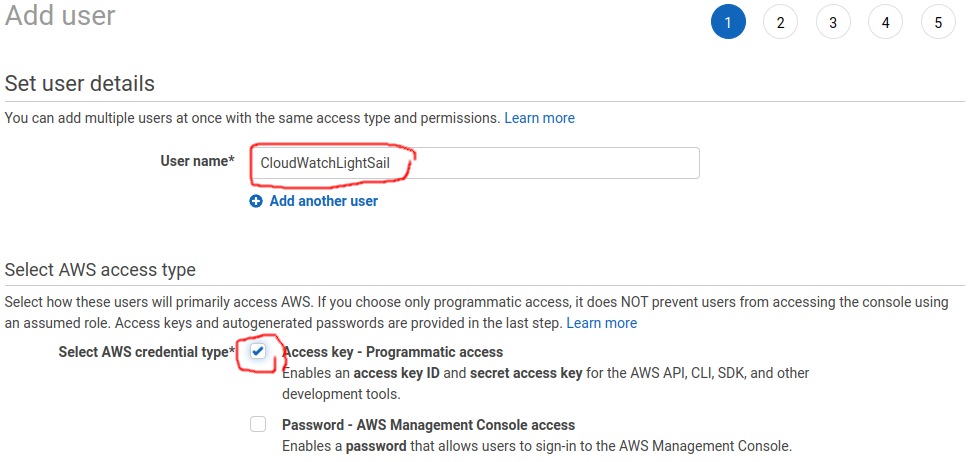
Put name, activate Access key – Programmatic access and Next.
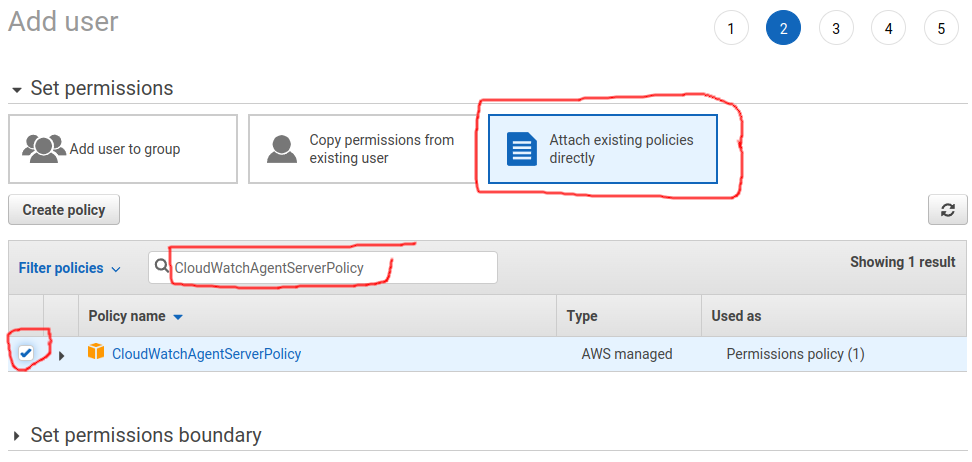
Select Attach existing policies directly, input CloudWatchAgentServerPolicy on Filter policies and Next.
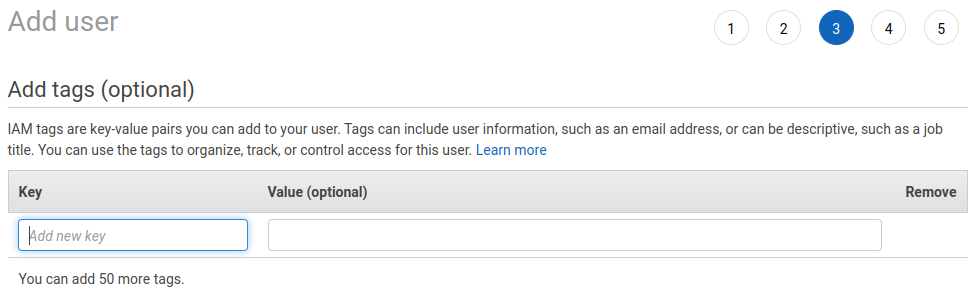
If you don’t need tag you can click Next.
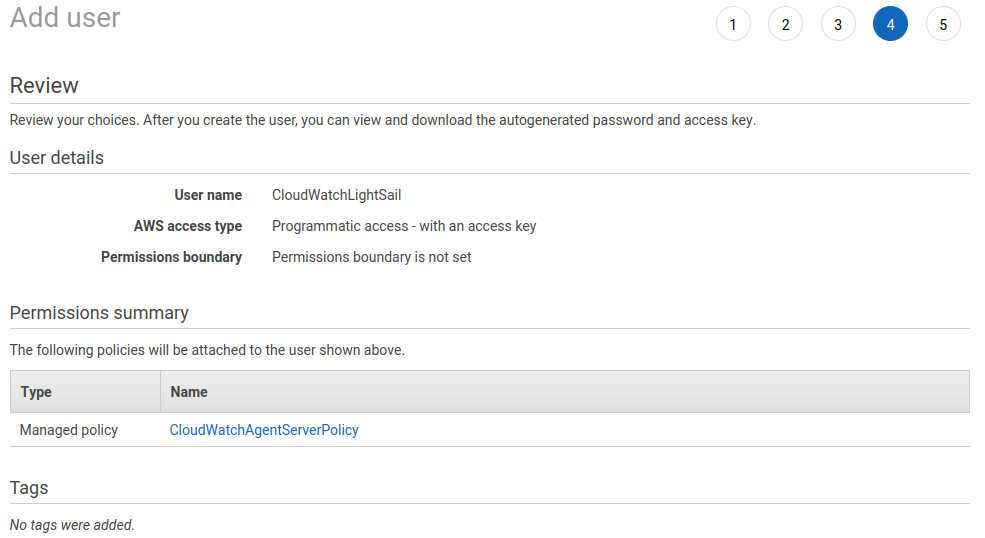
If configuration is fine then you can Create user.
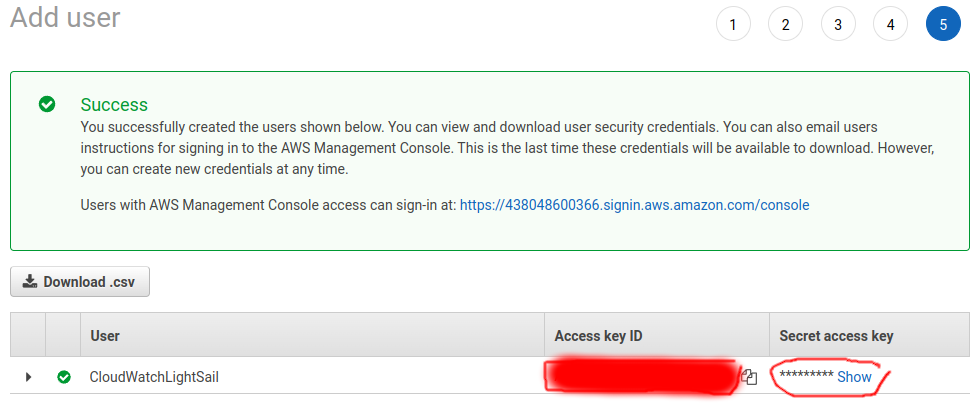
User is created successfully.
Please take note of Access key ID and Secret access key.
LightSail
Basically you can follow this page’s instruction.
I added these steps, but may be optional.
sudo yum install amazon-cloudwatch-agent
sudo amazon-linux-extras install collectd
In this command line you need to input what you got in previous step.
I set Tokyo region because I live in Yokohama.
I referred this article(Japanese).
sudo aws configure --profile AmazonCloudWatchAgent
AWS Access Key ID [None]: YourAccessKeyID
AWS Secret Access Key [None]: YourSecretAccessKey
Default region name [None]: ap-northeast-1
Default output format [None]: (Enter)
(After this you can just Enter)
I was asked “do you want to add log file to be monitored?”, so I added syslog.
> Log file path:
/var/log/syslog
Log group name:
default choice: [syslog]
In the end of command line you will see the location of configuration “/opt/aws/amazon-cloudwatch-agent/bin/config.json”.
I added CPU usage and TCP connection counts.
{
	"agent": {
		"metrics_collection_interval": 60,
		"run_as_user": "root"
	},
	"logs": {
		"logs_collected": {
			"files": {
				"collect_list": [
					{
						"file_path": "/var/log/messages",
						"log_group_name": "syslog",
						"log_stream_name": "{instance_id}",
						"retention_in_days": -1
					}
				]
			}
		}
	},
	"metrics": {
		"aggregation_dimensions": [
			[
				"InstanceId"
			]
		],
		"append_dimensions": {
			"AutoScalingGroupName": "${aws:AutoScalingGroupName}",
			"ImageId": "${aws:ImageId}",
			"InstanceId": "${aws:InstanceId}",
			"InstanceType": "${aws:InstanceType}"
		},
		"metrics_collected": {
			"collectd": {
				"metrics_aggregation_interval": 60
			},
			"cpu": {
				"measurement": [
					"cpu_usage_idle",
					"cpu_usage_iowait",
					"cpu_usage_user",
					"cpu_usage_system"
				],
				"metrics_collection_interval": 60,
				"resources": [
					"*"
				],
			"totalcpu": false
			},
			"disk": {
				"measurement": [
					"used_percent"
				],
				"metrics_collection_interval": 60,
				"resources": [
					"*"
				]
			},
			"mem": {
				"measurement": [
					"mem_used_percent"
				],
				"metrics_collection_interval": 60
			},
			"netstat": {
				"measurement": [
					"tcp_established",
					"tcp_time_wait"
				],
				"metrics_collection_interval": 60
			},
			"statsd": {
				"metrics_aggregation_interval": 60,
				"metrics_collection_interval": 10,
				"service_address": ":8125"
			}
		}
	}
}
However amazon-cloudwatch-agent refers other file “/opt/aws/amazon-cloudwatch-agent/etc/amazon-cloudwatch-agent.json”.
sudo systemctl status amazon-cloudwatch-agent
● amazon-cloudwatch-agent.service - Amazon CloudWatch Agent
   Loaded: loaded (/etc/systemd/system/amazon-cloudwatch-agent.service; enabled; vendor preset: disabled)
   Active: active (running) since Thu 2022-09-29 14:36:42 UTC; 36s ago
 Main PID: 19055 (amazon-cloudwat)
    Tasks: 7
   Memory: 19.1M
   CGroup: /system.slice/amazon-cloudwatch-agent.service
           └─19055 /opt/aws/amazon-cloudwatch-agent/bin/amazon-cloudwatch-agent -config /opt/aws/amazon-cloudwatch-agent/etc/amazon-cloudwatch-agent.toml -envconfig /opt/aws/amazon-cloudwatch-agent...

Sep 29 14:36:42 ip-172-26-0-182.ap-northeast-1.compute.internal systemd[1]: Stopped Amazon CloudWatch Agent.
Sep 29 14:36:42 ip-172-26-0-182.ap-northeast-1.compute.internal systemd[1]: Started Amazon CloudWatch Agent.
Sep 29 14:36:42 ip-172-26-0-182.ap-northeast-1.compute.internal start-amazon-cloudwatch-agent[19055]: /opt/aws/amazon-cloudwatch-agent/etc/amazon-cloudwatch-agent.json does not exist or cann...ing it.
Sep 29 14:36:42 ip-172-26-0-182.ap-northeast-1.compute.internal start-amazon-cloudwatch-agent[19055]: I! Detecting run_as_user...
Hint: Some lines were ellipsized, use -l to show in full.
So I created symbolic link.
cd /opt/aws/amazon-cloudwatch-agent/etc/
sudo ln -s ../bin/config.json amazon-cloudwatch-agent.json
ls -l /opt/aws/amazon-cloudwatch-agent/etc/
total 16
drwxr-xr-x 2 root root   30 Sep 29 13:55 amazon-cloudwatch-agent.d
lrwxrwxrwx 1 root root   18 Sep 29 14:38 amazon-cloudwatch-agent.json -> ../bin/config.json
-rw-rw-r-- 1 root root 3054 Sep 29 14:38 amazon-cloudwatch-agent.toml
-rw-r--r-- 1 root root  991 Sep 26 15:31 common-config.toml
-rw-r--r-- 1 root root    2 Sep 29 14:38 env-config.json
-rw-r--r-- 1 root root   85 Sep 29 14:38 log-config.json
I restarted daemon to reflect new configurations.
sudo amazon-cloudwatch-agent-ctl -a stop
sudo amazon-cloudwatch-agent-ctl -a start
After some minutes you should be able to see metrics like below!
Conclusion
How was it?
We can check CPU/memory/disk usage without logging in by SSH!
You can add alerting when exceeding threshold value or like that!
Comments